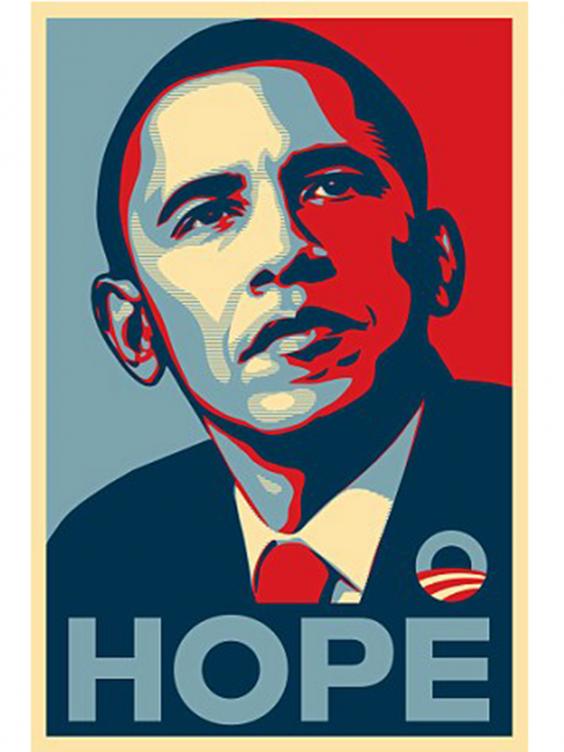
http://static.independent.co.uk/s3fs-public/styles/story_medium/public/thumbnails/image/2015/10/22/15/Obama.jpg
https://encrypted-tbn1.gstatic.com/images?q=tbn:ANd9GcS267KQWXWxGiQOrVwjFVegGFjdRdUfb7nl7kmIW1xhJefCHeBQ
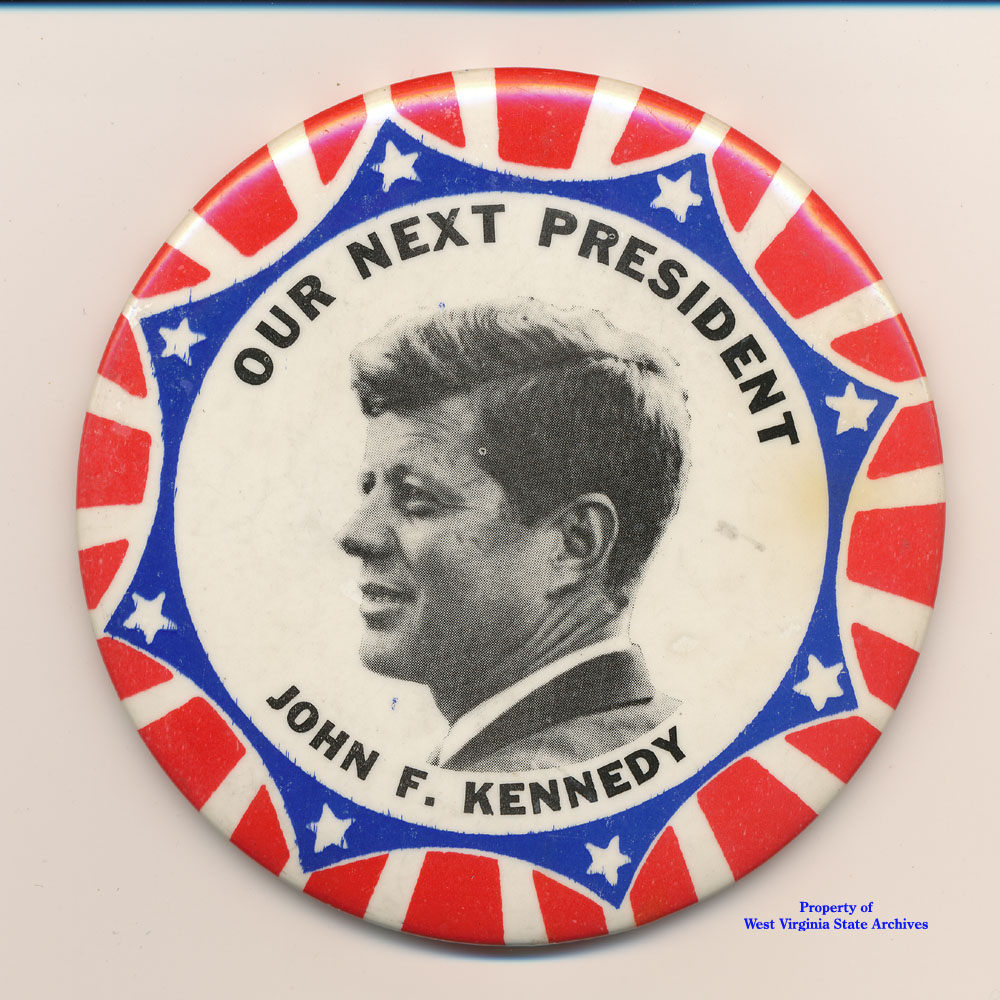
http://www.jfklibrary.org/~/media/assets/Museum%20Objects/Artifacts/Campaign%20and%20Inaugrual/MO95-77%20%20%20Leadership%20for%20the%2060s%20campaign%20poster.jpg
http://www.ithaca.edu/depts/i/Andrew_Redford_Young,_Poster_Promoting_Mitt_Romney,_2011/57213_photo.jpg
http://www.fadwebsite.com/wp-content/uploads/obama1.jpg
http://mediamatters.org/static/images/item/LoC-20120920-Lincoln.jpg
http://ih1.redbubble.net/image.55912501.6385/fc,220x200,army.u1.jpg
http://assets.fontsinuse.com/static/use-media-items/8/7927/full-1000x1000/56214d67/jfkdoc076.jpeg?resolution=0
http://www.lbjlibrary.org/cache/assets/uploads/general/presidential_poster_300_443_s_c1.jpg
https://blogger.googleusercontent.com/img/b/R29vZ2xl/AVvXsEgYb79u0D6ZD6ScWReQeyYgp14CuceSKTsPKSz1pwg0rWbp8UFcq75Ptr8MgUaSH2oDIT766CM0pEi8TPBkSYX59ha9UnxuZS5Z2AEUcBUNsn215jffI8mh0IG788ZSf934_4bV-5hvWEY/s400/obama_hope_progress_change.jpg